“Why sudden drop in the record count, while the incoming stream and data size is unaffected?” is the most common question in the data engineering world.
Now, we need to backtrack and understand the run details along with the processed data: was there any bulk data received with nulls in important fields, was there a missing dataset from any of the join tables, or what value was passed as a parameter?
In the Databricks world, we can check the previous run by going through the notebooks, but it has a limitation of 60 days.
Additionally, executing commands like show and count will trigger an extra action in the job and bring down the performance, so these kinds of commands should not happen regularly, only when the data pipeline is in debug mode.
That is why it is important to log the runtime variables along with some of the run stats, along with dynamically controlling the addition of extra commands only in debugging mode, which will be helpful for easy backtracking.
In this article, we will explore how to log using the Python logging library and store it in a UC-managed volume for future retrieval.
Python library logging
It is used for emitting the logs from the code at precise control.
If the developer in debug mode he or she expects more verbose but in production mode, very less verbose to keep it in clean.
Without changing the code, it is possible sending right config parameter, it is achievable.
There are different levels available, each emits based on their level. Below is the description for the level in data engineer perspective.
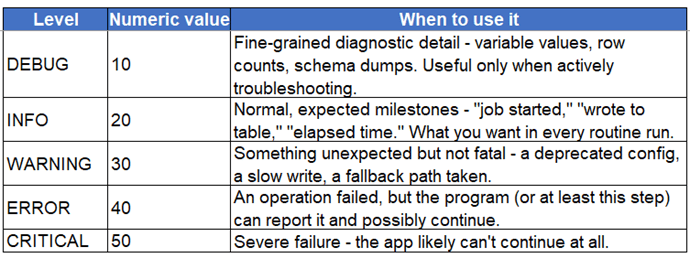
Logging in databricks context
As databricks Lakeflow jobs runs based on spark distributed engine, the logs available in every node. Most of the valuable logs from driver, so we will be focusing on driver node.
Additionally, it is well known spark is lazy evaluation and triggers only action, so the action commands which used for debugging will be added in only debugging mode.
Has already mentioned, databricks has some limitation in keeping the run details, so it is good to capture in the UC managed volume, so that will be use full at later point and eventually we can purge it.
Actions for setup:
- Provision to pass the parameter for log level
- Setup the handler and provide the volume path to store the logs
- Properly define the commands in the conditional clause to specify the mode in which they should run.
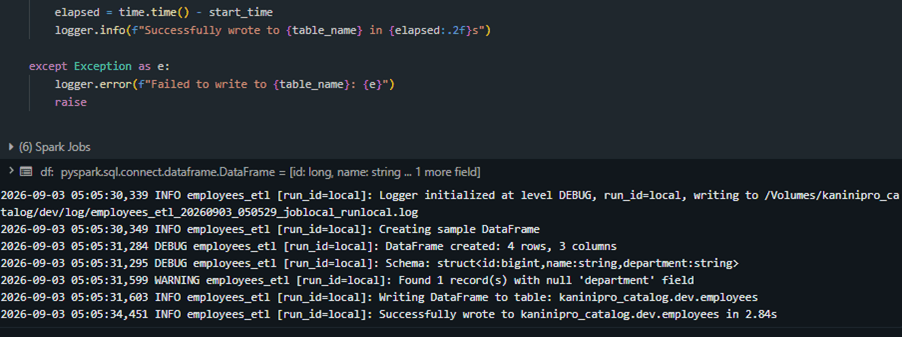
Here is the log emittance for sample pyspark code:
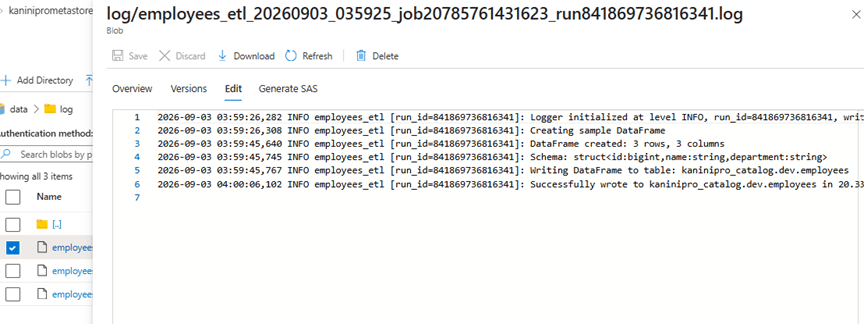
And the log stored in the ADLS which is UC managed volume.
I attached the source code in the link: source_code
There is a caveat.
If someone bumps log_level=DEBUG in production just to see more detailed messages during an incident, they also silently trigger df.count() on a potentially huge table — an expensive, possibly slow action they didn’t intend to cause.
Debug logging and “run extra diagnostics” get coupled together, which can surprise people. The work around is, it can be decoupled.
Outro
I hope this article explains the importance of logging and basic implementation.
Happy Learning!!

Leave a comment