Databricks provides a rich user interface that makes it easy to interact with notebooks, jobs, clusters, and data objects. But as your platform grows, teams mature, and automation becomes a requirement, the Databricks Command Line Interface (CLI) becomes an indispensable tool.
In this blog, we’ll explore what the Databricks CLI is, why it exists, and how it offers major advantages over the UI — especially for pulling clusters, jobs & details.
Obviously CLI usage is not ends with the scope what I explain, but I will limit the purpose for this article and take this further with other articles.
Commands and code used in the article is attached here: source
Databricks Authentication
There are different ways to authenticate, let me do with databricks personal access token(legacy) for sake easiness.
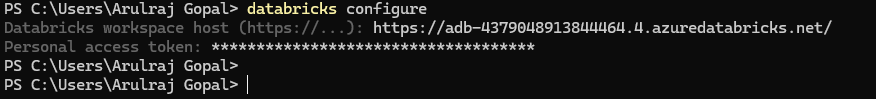
Once authenticated, we can see the databricks cfg file in the below location at base machine, that is evidence that it authentication processed

Confirming the authentication

No need to login multiple times in base machine. One time login is enough for a while.
Clusters command group
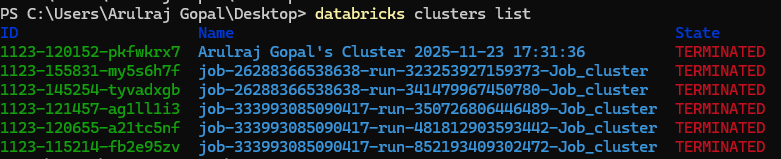
The databricks clusters list command quickly shows all clusters with their IDs, names, and current states. To inspect a specific cluster in detail, databricks clusters get returns its full configuration and status.
These commands help automate cluster monitoring without relying on the Databricks UI.

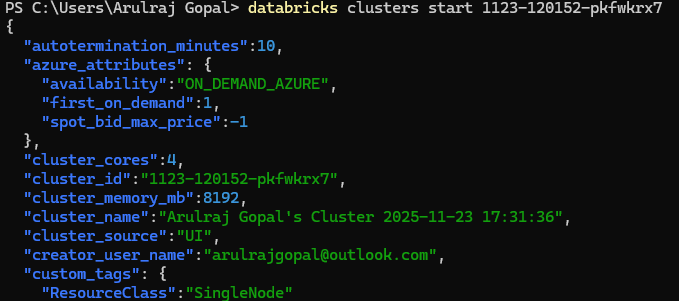
Starting the cluster
Terminating the cluster

Job list & runs
Commands like jobs list and jobs list-runs make it easy to pull detailed job insights directly from the terminal. Instead of navigating through multiple screens in the Databricks UI, the CLI gives you instant visibility into job definitions, run history, statuses, and timing.


Extract the job run from some timing — This command returns the Unix epoch timestamp in milliseconds for the current time minus 4 hours. It converts the adjusted time to UTC and calculates how many milliseconds have passed since 1970-01-01 into variable “start_time”.
Then the next command, helps you to fetch only recent or relevant runs.

Capture the Job run with log
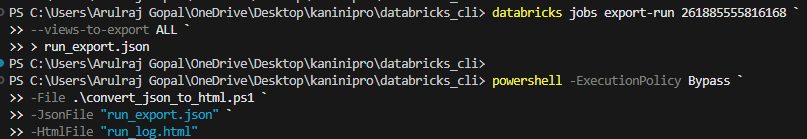
When you want to exports the Databricks job, it can be done through below command and save as JSON.
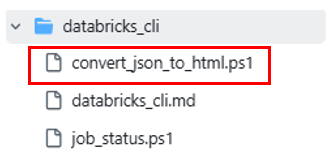
And there is small PowerShell script extracts the embedded HTML log so you can open it directly in any browser. It’s a quick way to capture, convert, and view full run details without going back to the Databricks UI. With this any job log can be checked and downloaded easily.
Powershell script to convert downloaded json to html.

Extract Job details from specific time
I want to quickly see the last 5 hours of runs, their statuses, and how long each execution took for a specific Databricks job.
So, I created (Actually I asked AI) a script where I simply pass the job ID and the number of hours to look back. The script automatically calculates the correct UTC window, pulls all matching runs, and prints complete details. This makes monitoring recent job activity far easier than navigating through the UI or entering times manually.
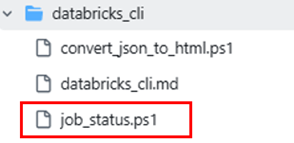
Powershell script to fetch job details from time.
In the same repo.

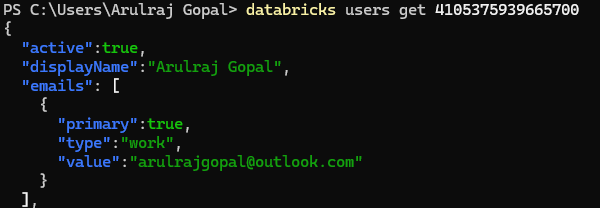
Get the user list and details
Here is another command group related to users, and it will be useful to get details about users and details.

Other command groups which I felt important
- Databricks bundle
- Databricks secrets
- Databricks lakeview
- Databricks auth
Conclusion
The Databricks CLI brings speed, automation, and precision that the UI simply can’t match, especially for managing clusters and extracting job insights. It streamlines tasks like filtering runs, exporting logs, and monitoring activity without navigating multiple screens. While this article covers the essentials, the CLI’s capabilities go far beyond — and future posts will dive even deeper
References

Leave a comment