Many people think Parquet is a columnar format. That is not entirely true.
Parquet is actually a hybrid format—it blends the strengths of both row-based and columnar storage.
This has become the go-to file format for data engineering.
So, what makes it special? Why is it so widely adopted in modern data platforms?
Let’s break it down in this article.
Parquet format capabilities
- Supports column pruning – reads only required columns.
- Parallel reads – even single file can be read with multithreading.
- Efficient encoding – repetitive values stored once.
- Metadata driven – scans only relevant blocks and skips unnecessary data
- Self-Describing format – No need for external schema definitions
- Supports nested data structures – natively support array & maps
- Supports multiple compression codecs – Snappy, Gzip, ZSTD, LZO, etc.
With these capabilities, Parquet is highly optimized for analytical workloads.
Row based, columnar and parquet structure
Before jumping into Parquet, let’s first understand the difference between row-based and columnar formats.
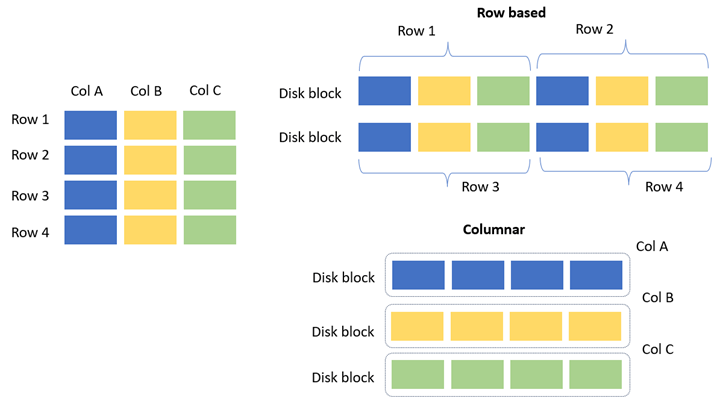
- In row-based systems, data is stored in disk blocks row by row.
- In columnar systems, data is stored column by column within disk blocks.
Both approaches have their own pros and cons. For OLAP systems, columnar storage is usually the better choice. For OLTP systems, row-based storage is preferred, since in most cases all columns of a row need to be read together.
The below image illustrates this difference more clearly.
Parquet data structure as hybrid. As shown in the image below, a row is divided into Row Groups (RGs), and each row group is further divided into Column Chunks. Data is then written to storage row group by row group into disk blocks.
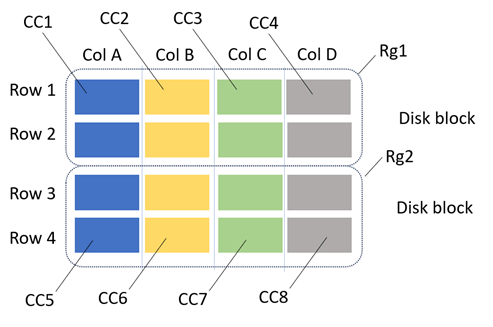
Note: In real scenarios, a row or column may not fully fit into a single disk block. In such cases, the remaining portion spills over into the next disk block. The illustration here is simplified for clarity.
Architecture of Parquet
How parquet is stores data in hybrid and efficiently reading performing.

- Row group: A logical horizontal partitioning of the data into rows. There is no physical structure that is guaranteed for a row group. A row group consists of a column chunk for each column in the dataset.
- Column chunk: A chunk of the data for a particular column. They live in a particular row group and are guaranteed to be contiguous in the file.
- Page: Column chunks are divided up into pages. A page is conceptually an indivisible unit (in terms of compression and encoding). There can be multiple page types which are interleaved in a column chunk.
- Footer: contains file metadata
- Page header metadata contains information about encoding. So, the reader can use this for decoding the data.
- This magic number indicates that the file is in parquet format.
Parquet Slice and dice analysis
A Parquet file is written using the Spark code shown below. The key point to note is that an ORDER BY “city” column was applied on the DataFrame. As a result, while storing the data, each row group contains ordered city values instead of random distribution.

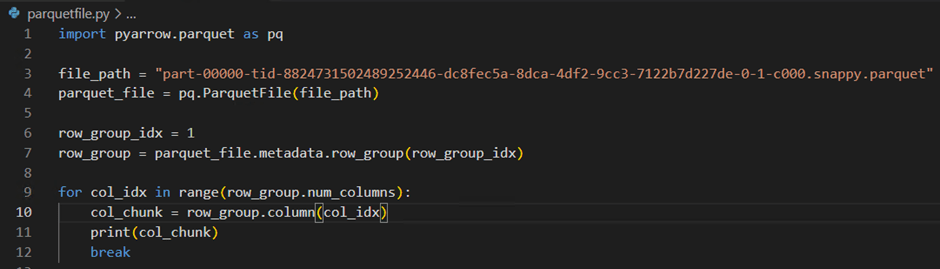
For analysis, I downloaded the file locally and inspected its metadata using pyarrow. From this, it is clear that the file contains two row groups.

While inspecting one of the column chunks, the details revealed a lot of useful information, including the data type, minimum, and maximum values. Using these min and max statistics, data scans can be performed more efficiently by skipping irrelevant blocks.

Demo on limiting data scan
The table below illustrates how the data is laid out for the “city” column which take from previous query. It clearly shows that while writing to Parquet, the ORDER BY city was applied, resulting in cities being sorted and divided into two row groups alphabetically.

The PySpark code below calculates the count of people in a few listed cities whose salary is greater than 30K. For this query, only the salary and city columns are required. Since all the listed cities fall within row group 0 , Spark can skip scanning row group 1. Let’s see the spark execution metrics that how it performed the data scan effectively.

Spark SQL plan

Spark scan metrics from spark UI

From the Spark plan, it is clear that only the required two columns were read. The scan metrics further confirm that out of the two row groups, only one was scanned while the other was skipped as unnecessary. In other words, for this query, Spark processed only about 10% of the data to produce the result.
Capabilities like this are what make the Parquet format stand out.
Conclusion
Parquet’s hybrid design combines the best of row-based and columnar storage, making it both flexible and efficient. Its metadata-driven optimizations enable selective scans, pruning, and compression that save time and resources.
This is why Parquet has become the backbone of modern analytical data platforms.

Leave a comment