Most data engineering professionals have worked with Databricks at some level—whether exploring it casually or using it deeply in production. One of the most essential aspects of managing Databricks is understanding and monitoring costs.
At a high level, the total cost of a Databricks workspace can be tracked using cloud provider cost analysis tools (Azure Cost Analysis, AWS Cost Explorer, GCP Billing, etc.). But what if you want to go deeper—to monitor which specific jobs consume the most DBUs, or to identify potential cost leaks?
That’s where Databricks System Tables come into play. These tables allow you to monitor costs at a granular level, job by job. And beyond costs, they provide rich insights into various aspects of your Databricks environment.
Note:
- System tables are only available in environments where Unity Catalog (UC) is enabled.
- DBU (Data Bricks Unit) is a normalized measure of processing power and platform services used by Databricks to price its services.
System Tables
In Databricks Unity Catalog, system tables are read-only datasets automatically provided inside the metastore. They give visibility into billing, lineage, audit logs, and operational metadata across your Databricks account and workspaces.
Properties of System Tables:
- Read-only – You can query them, but cannot insert, update, or delete records.
- Account-wide – They capture data across all workspaces linked to a Unity Catalog metastore.
- Governed by Unity Catalog – Access is managed through UC permissions (e.g., SELECT grants).
- Available only after UC enablement – No historical data is backfilled.
- Example: If a workspace ran clusters for 3 months without UC and UC is enabled today, system.billing.usage will only track usage from today onward.
- Data refresh lag – Some tables (like billing) refresh hourly or daily, not in real time.
- Storage location – Physically stored and managed by Databricks, not in your cloud storage account.
Can You Query System Tables Without a Workspace?
- Since system tables are account-level, the data persists even if individual workspaces are deleted.
- However, you still need an active workspace to run queries (via SQL queries, notebooks, or Databricks SQL warehouses).
- If your only workspace is deleted, you cannot directly query the data, because queries always run in the context of a workspace.
Some of the most useful ones:

Demo
For this demo, I’m using Azure Databricks as the cloud platform. Two workspaces were created with Unity Catalog enabled.

You can explore system tables through the account-level login at: https://accounts.azuredatabricks.net/
This login gives you an account-wide view, not just workspace-level access.
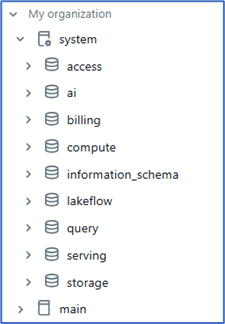
After unity Catalog enabled below system tables are visible and accessible.
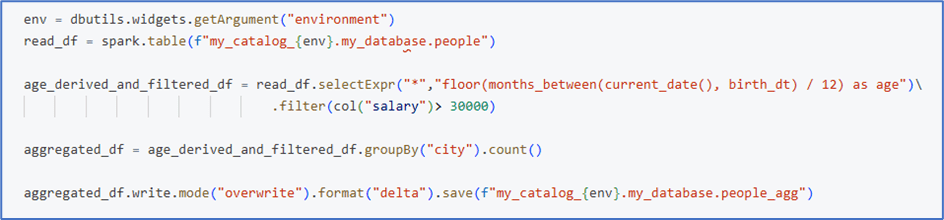
Below Job created with task1 and task2 in both environments and successfully completed.

Task1:

Task2:
Let’s start and query some of the most viewed system tables and get insights.
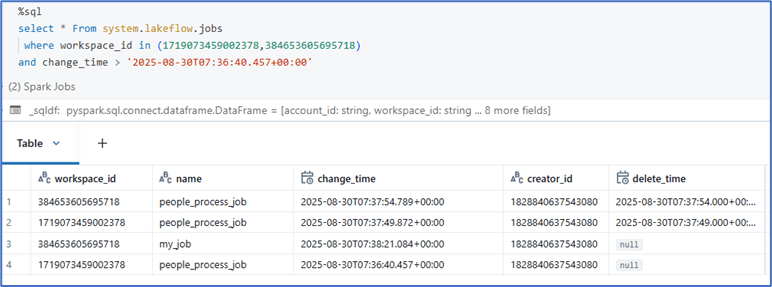
Job details:
Job run details:

Job task details:

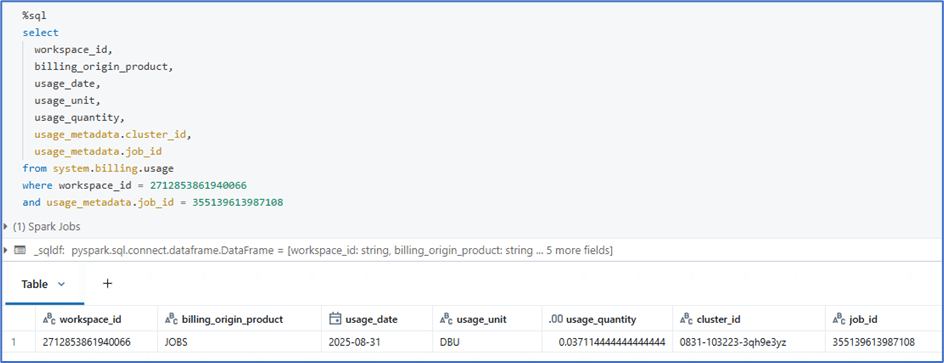
Billing usage:
It provides detailed information about DBU utilized per job and workspace level with the type of compute used.
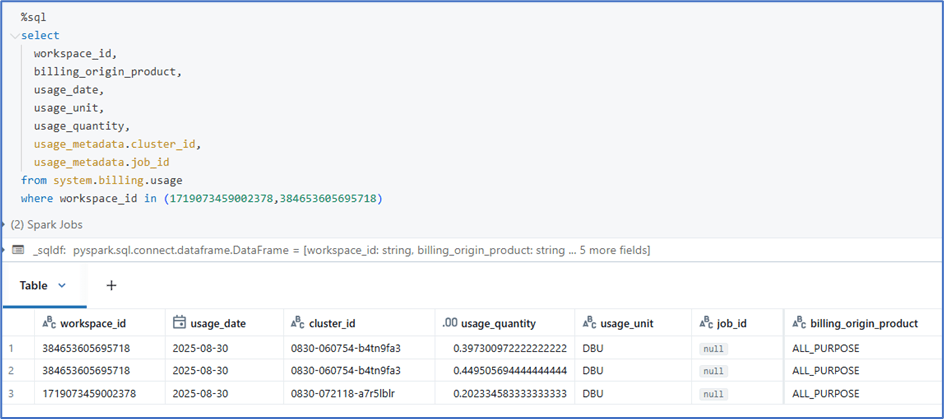
Since interactive cluster is used in the demo, the job_id is not populating, In case of job_cluster, the job_id will be populated, so that we can aggregate with job_id to understand DBU consumption based on jobs.
Another example query, to fetch DBU consumed with job_id. We can aggregate using job_id to get total DBU used job by job.
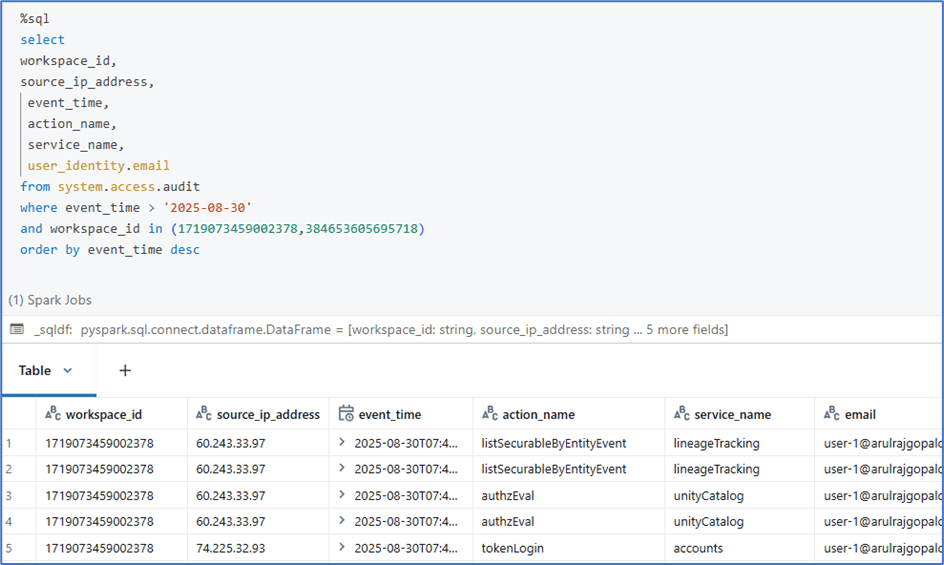
Audit logging:
The audit logs table records detailed information about actions and events occurring within a Databricks workspace or account. It is used for security auditing, compliance, and monitoring user and system activity.
Cluster details:

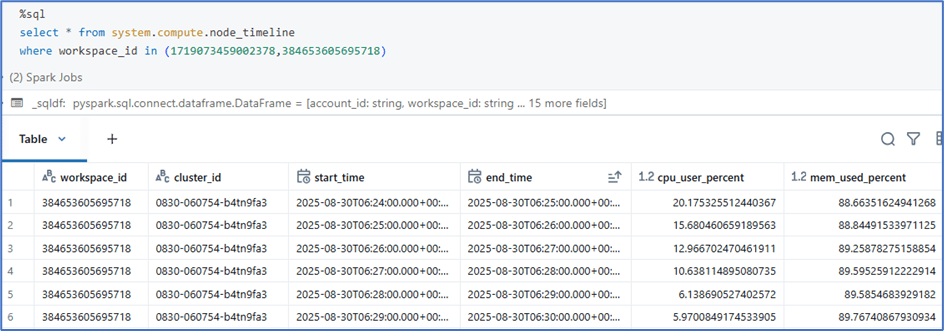
Node timeline:
The node timeline table captures node-level resource utilization data at minute granularity. Each record contains data for a given minute of time per instance.
External locations details:
Since in this demo, no external locations created, only root location is available.
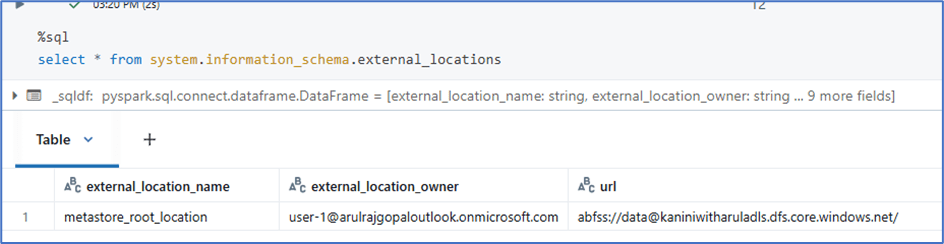
Table details:

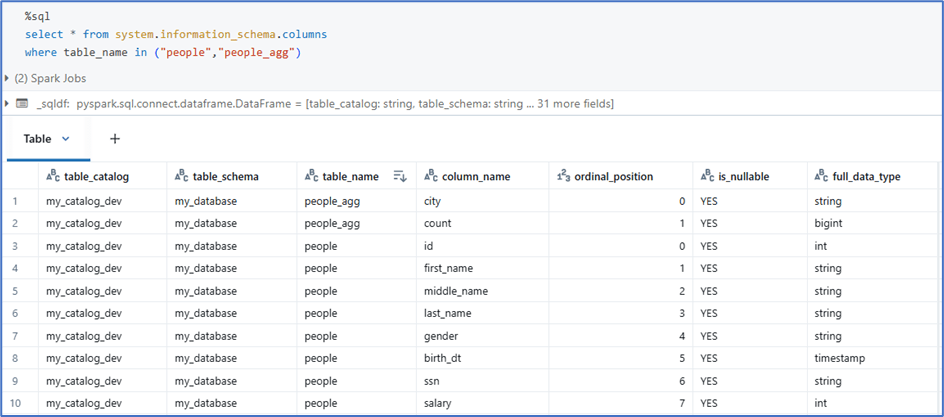
Column details:
Conclusion
With system tables, you gain job-level visibility into costs, audit trails for governance, and lineage insights for data pipelines—all of which are crucial for running Databricks efficiently. Beyond the examples covered here, there are many more system tables available, each offering valuable insights that you can explore and leverage based on your use case.

Leave a comment